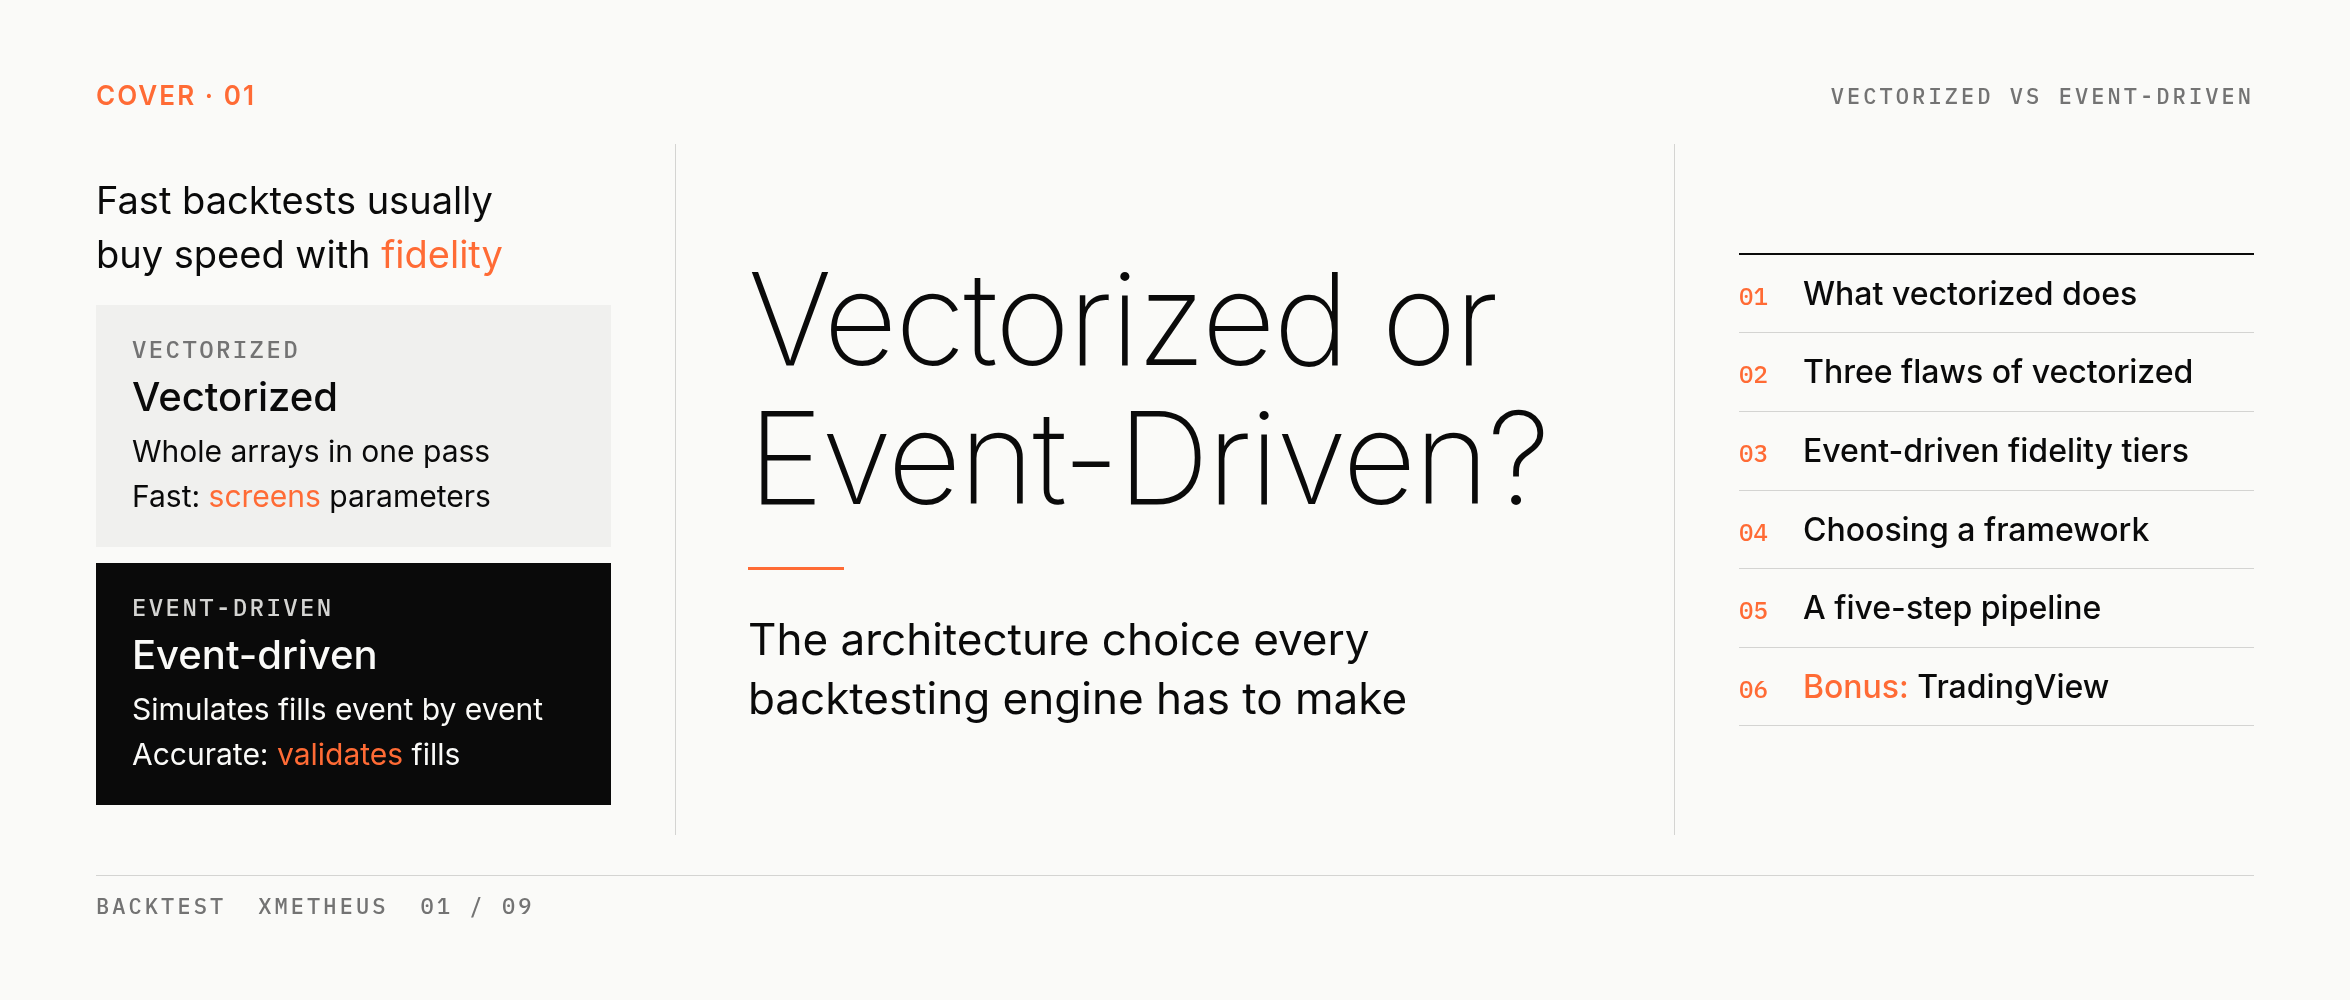
Building a backtesting engine raises plenty of design questions. One you can’t avoid is the core architecture: vectorized or event-driven.
Most people first run into it when the same strategy produces visibly different equity curves in two tools. Usually neither tool is buggy; the two architectures simply make different assumptions about how the market works. I took both apart and wrote down the pitfalls that are easy to hit and hard to notice.
The short answer: it isn’t either/or. They work best as two stages of one pipeline. Vectorized screens, event-driven validates. Which one you lean on, and how much fidelity you need, depends on how sensitive your returns are to execution details. Low-frequency strategies are fine with bar-level backtests; intraday strategies should use trade-level data; market making and HFT earn their edge from resting orders, where getting filled depends on queue position, so the backtest has to simulate the order book.
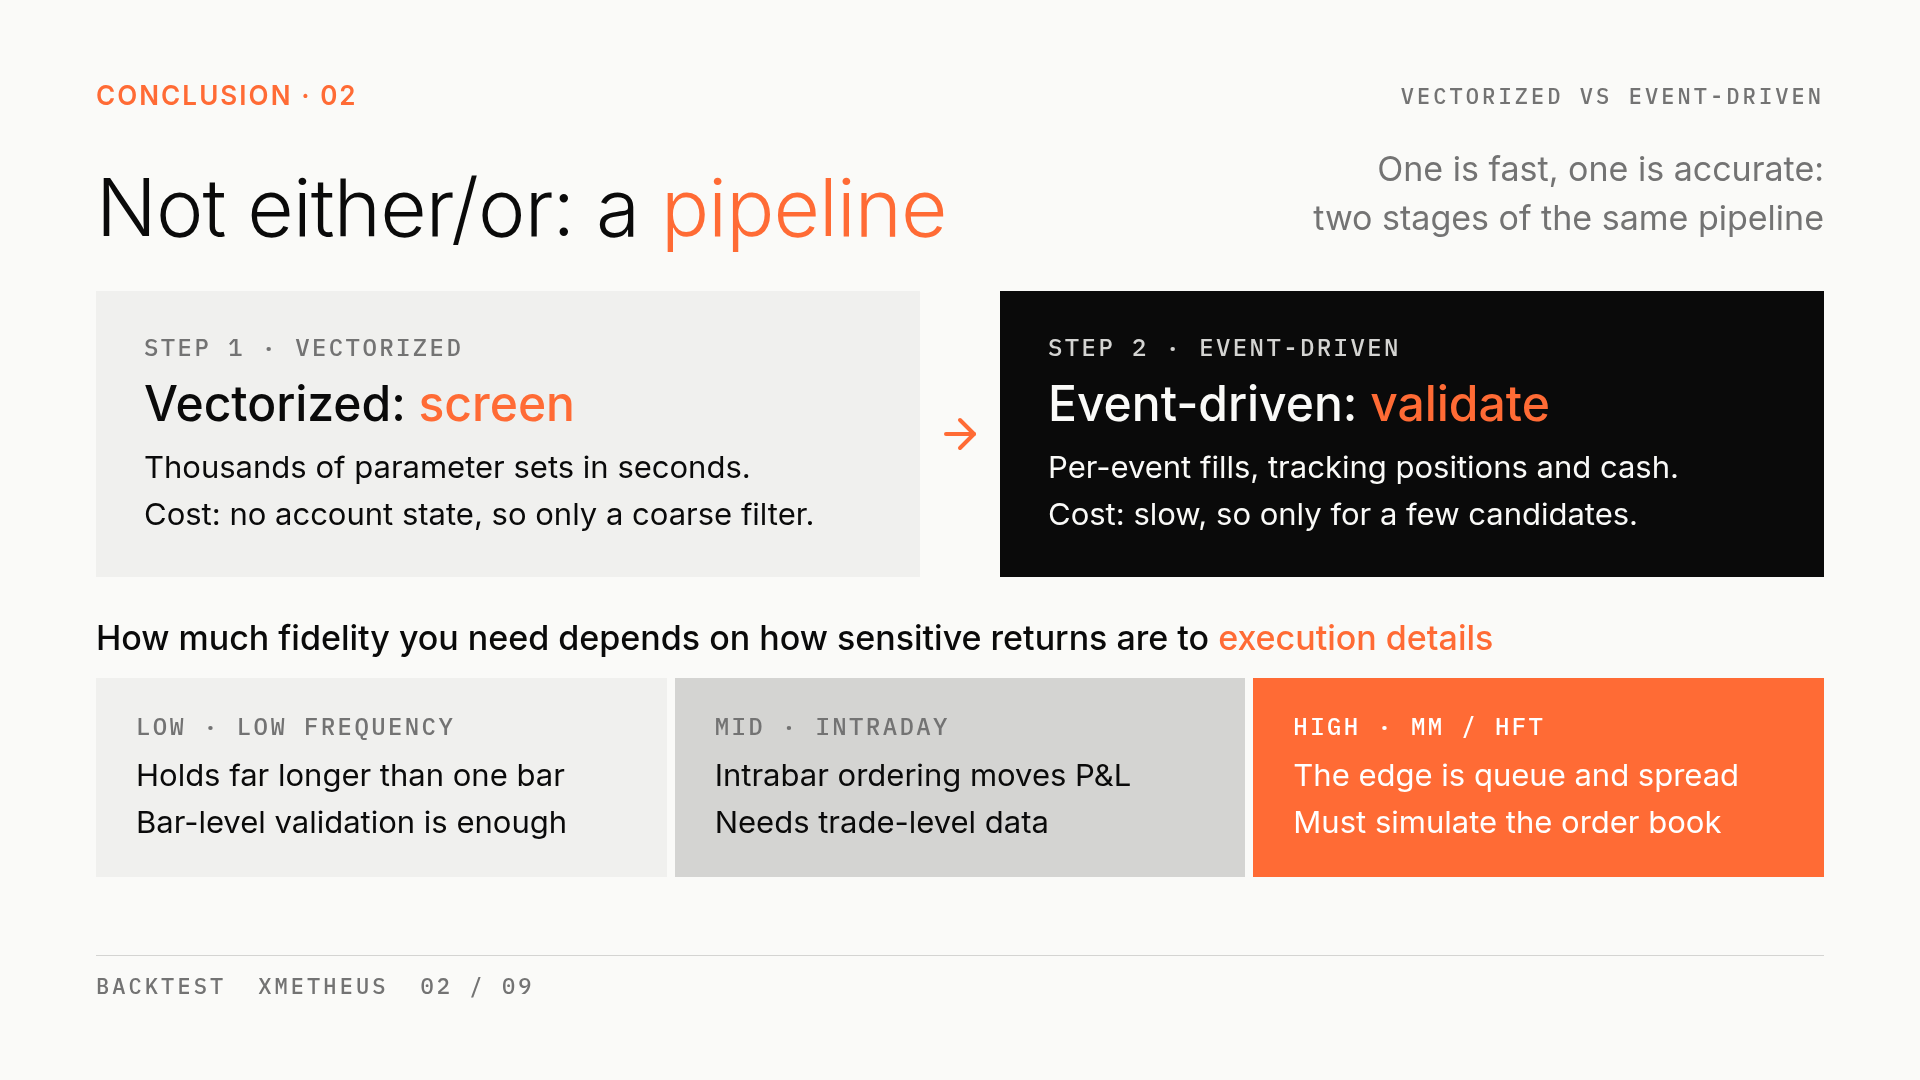
- A pipeline, not a choice: vectorized backtests screen parameters cheaply; event-driven backtests validate fills with full account state. Chain them.
- Three flaws of vectorized: lookahead bias, the intrabar path, and stateful logic, all rooted in treating every bar as independent.
- Event-driven has fidelity tiers too: bars, trades, order book. Touching your limit price is not a fill; market making and HFT need Tier 3.
- Pick frameworks by requirement: decide the fidelity tier and whether one codebase should go live. Backtrader is largely unmaintained (last commit April 2023).
- Close the loop in five steps: sweep → out-of-sample + DSR → event-driven validation → small live size → fill reconciliation, then recalibrate slippage and latency from the gap.
1. What a vectorized backtest actually does
A vectorized backtest treats the whole price history as arrays. Prices are one column; rules compute a signal column in one go; the signals are shifted forward by one bar to become positions; positions times returns give a return column, which is cumulated into equity. There is no bar-by-bar loop. Everything is a batch operation in NumPy or Numba.
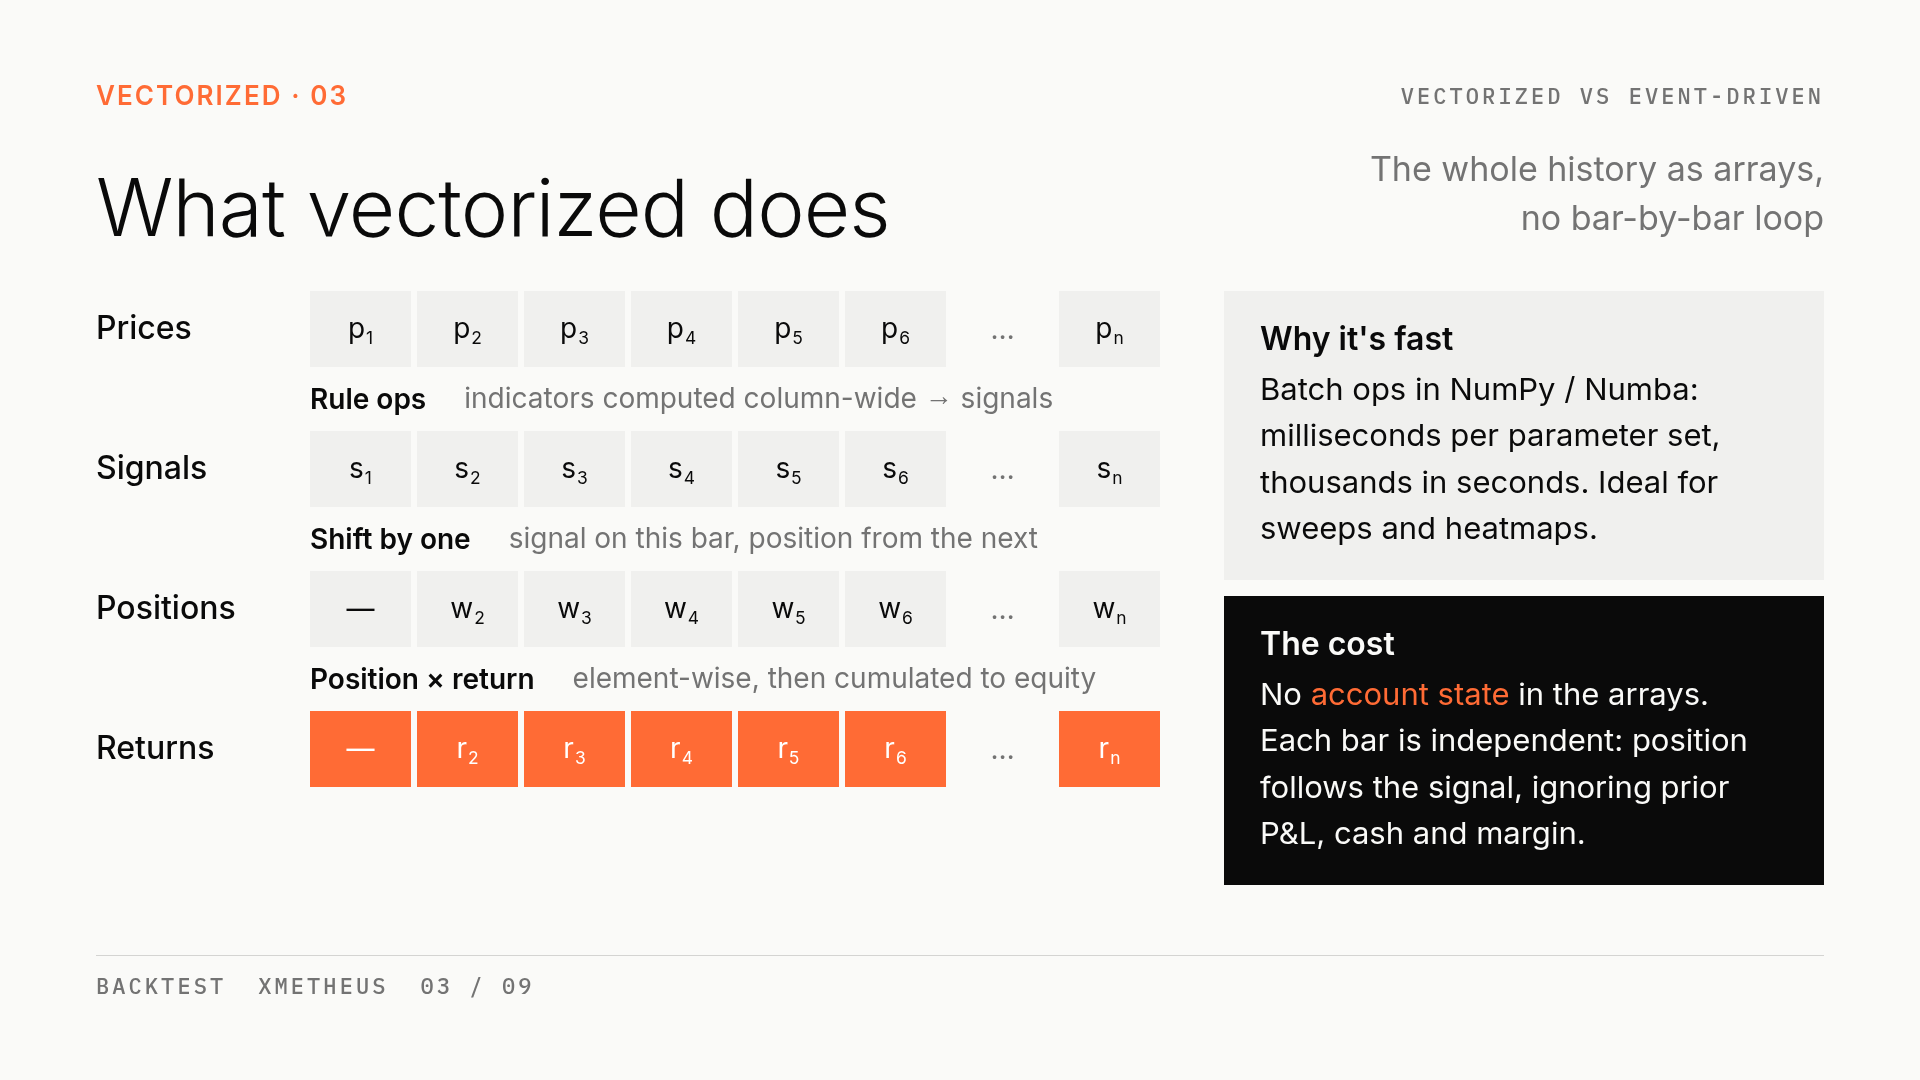
That’s where the speed comes from. One parameter set takes milliseconds and thousands take seconds, which makes sensitivity analysis and parameter heatmaps easy.
It’s also where the cost comes from. The arrays have no notion of account state at a given moment. Every bar is implicitly independent: this bar’s position depends only on the signal, not on whether the last bar made money, how much cash is left, or whether margin is sufficient. As soon as strategy logic becomes path-dependent, you have to bolt it onto the vectorized model, and the more you bolt on, the easier it breaks.
2. Three flaws of vectorized backtests
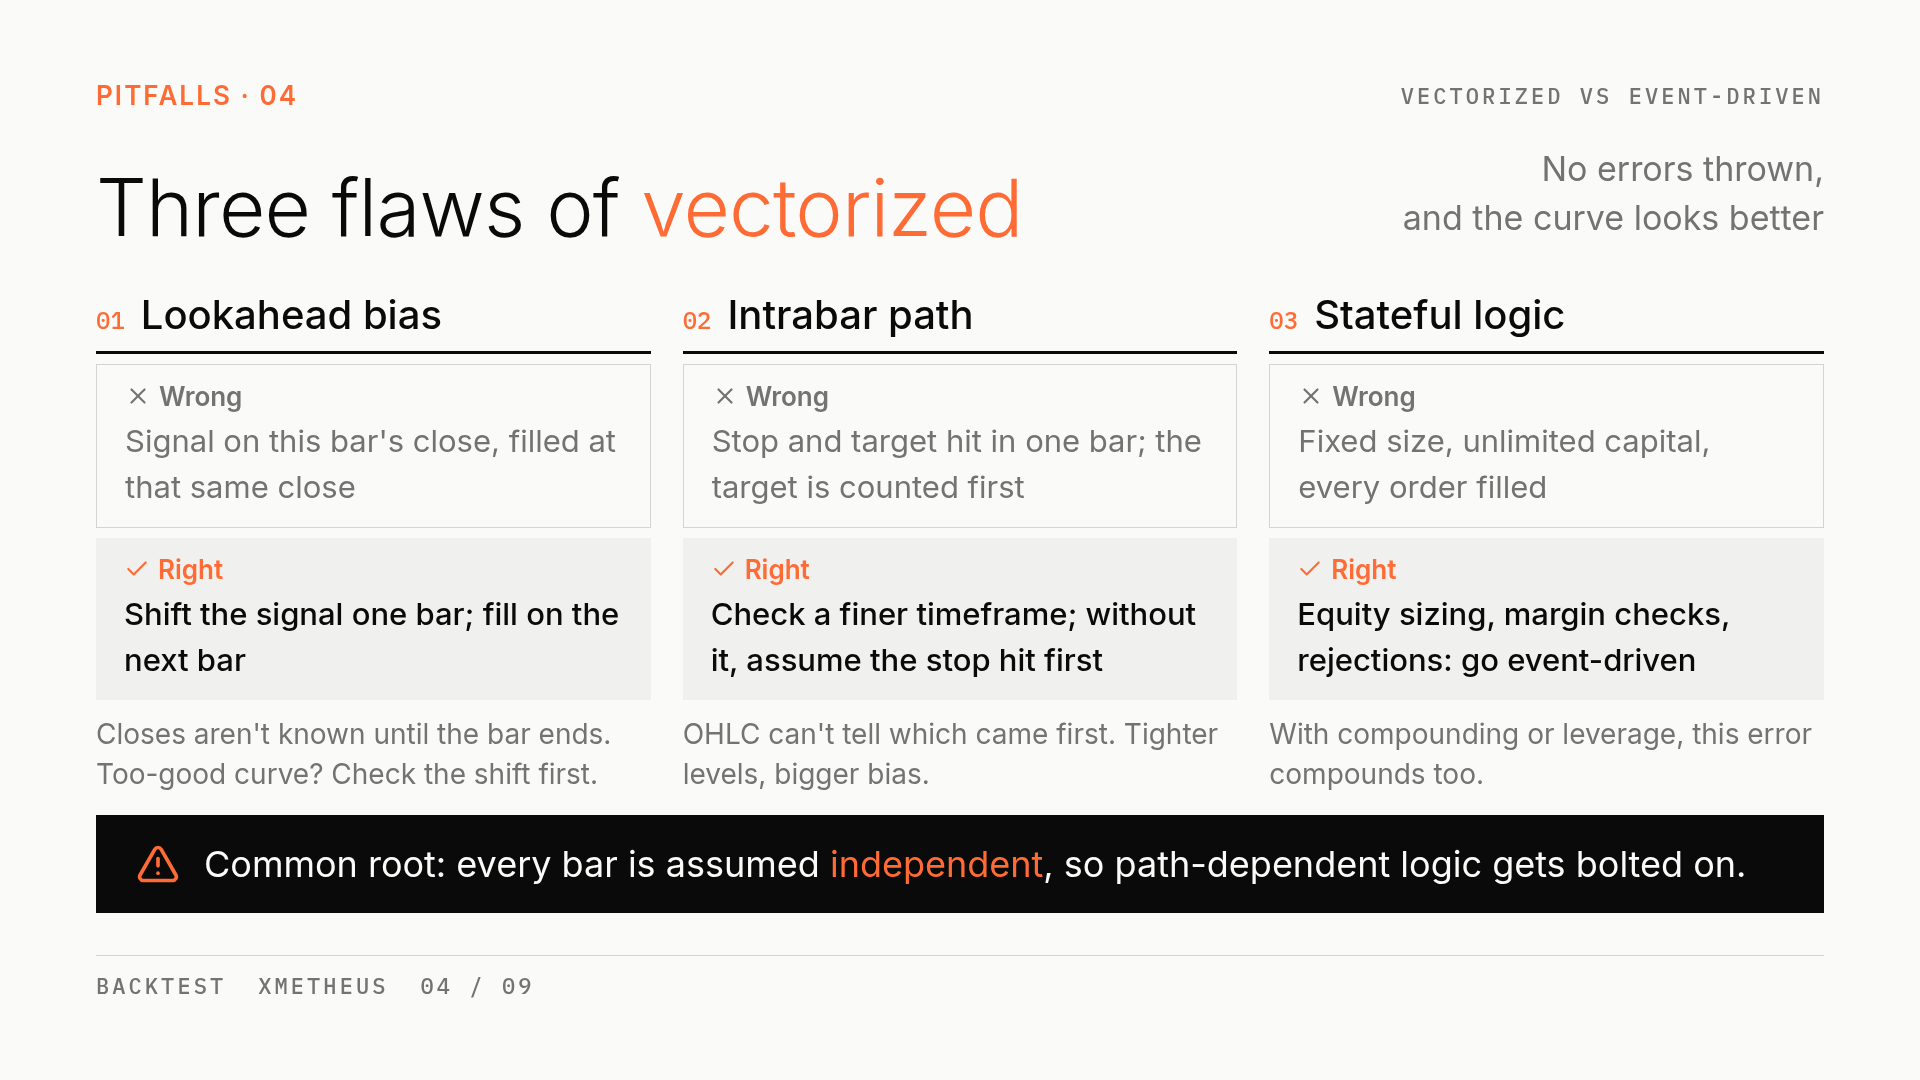
1. Lookahead bias. The most common version computes a signal on a bar’s close and fills at that same close. It looks natural, but the close isn’t known until the bar is finished; you can’t trade at a price you only learn afterwards. The fix is to shift the signal by one bar and fill on the next bar. This bug is especially sneaky in vectorized code: miss a single shift and nothing throws an error, the curve just looks better. When a curve looks too good, check this first.
2. The intrabar path. Within one bar, the high touched your take-profit and the low touched your stop-loss. Which one triggered first? Open, high, low and close can’t tell you, so you have to assume. Mature frameworks state their rule explicitly: VectorBT conservatively counts the stop-loss when both are hit, while TradingView infers the path from whether the open is closer to the high or to the low. The real risk is hand-rolled vectorized code: the order of a couple of if checks is written casually, ends up evaluating the target first, and quietly picks the favorable path every time. There are two honest ways to handle it: drop to a finer timeframe to see the actual sequence, or, without finer data, assume the worst case and take the stop first. The tighter the stop and target, the worse this gets.
3. Stateful logic. Sizing as a percentage of equity, margin checks and exchange rejections all depend on what just happened. Vectorized backtests usually assume fixed size, unlimited capital and guaranteed fills. If the strategy compounds its position or uses leverage, that error compounds too. Rather than patching this into a vectorized model, hand it to an event-driven engine.
All three share one root: vectorized backtests assume bars are independent, so path-dependent logic has to be forced in.
3. What an event-driven backtest does
Event-driven engines take the opposite approach: instead of computing everything at once, they simulate time moving forward. A clock dispatches events in time order; market events (bars, trades or order book updates) go to the strategy; the strategy places orders (market, limit, cancel); the matching engine simulates fills at the configured fidelity; fill reports flow back to update positions and cash; then the next event is processed.
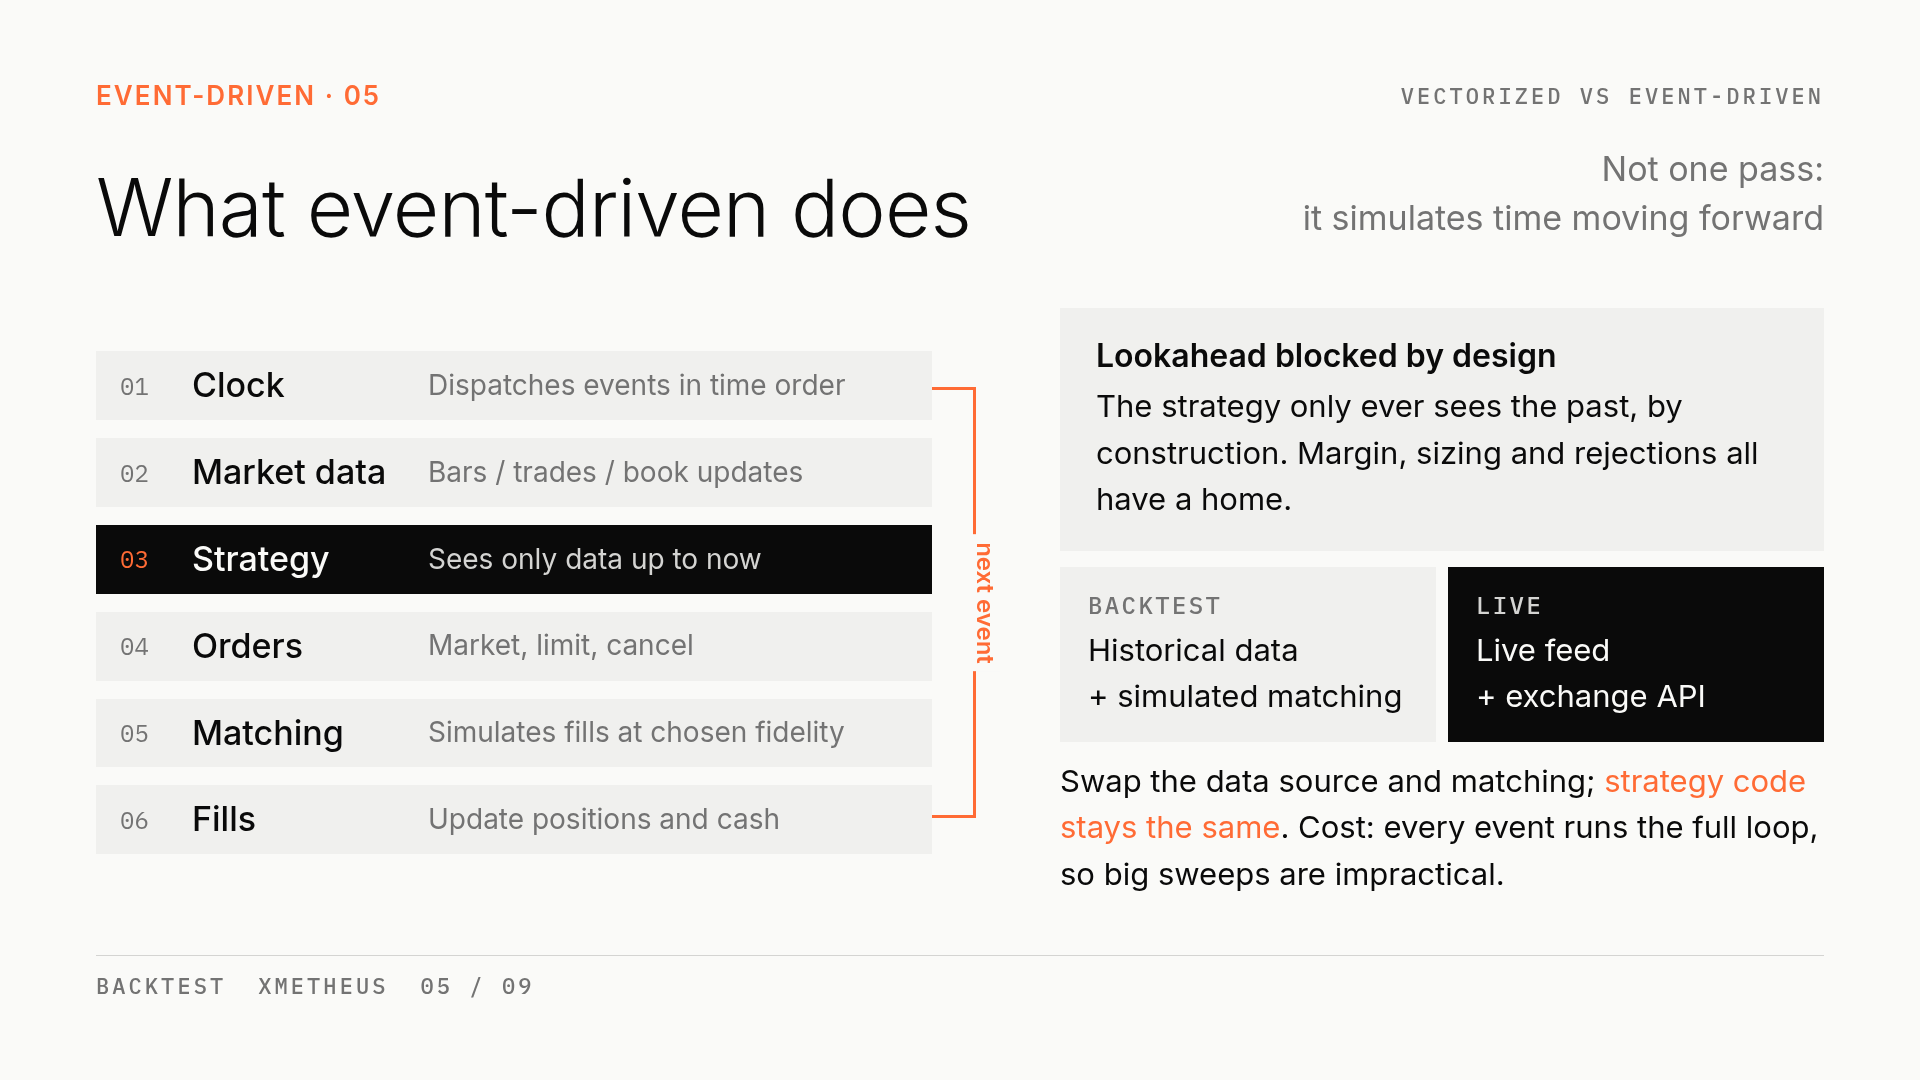
The biggest advantage is structural. At any moment the strategy can only see data up to that moment, so lookahead is blocked by the architecture instead of relying on your discipline. Account state is carried along the whole way, so margin, position sizing and rejections all have a natural place.
A second, underrated advantage: backtest and live trading can share the same strategy code. In backtests you plug in historical data and simulated matching; in production you swap in a live feed and the exchange API, and the strategy itself doesn’t change. Many “great in backtest, wrong in live” problems come from the strategy having been rewritten.
The downside is speed. Every event goes through the full loop; a Python engine can take minutes to run several years of minute bars for a single instrument, which makes sweeping thousands of parameter sets impractical.
4. Event-driven engines have three fidelity tiers
Many people assume event-driven means accurate. In fact fidelity varies a lot between event-driven engines, roughly in three tiers.
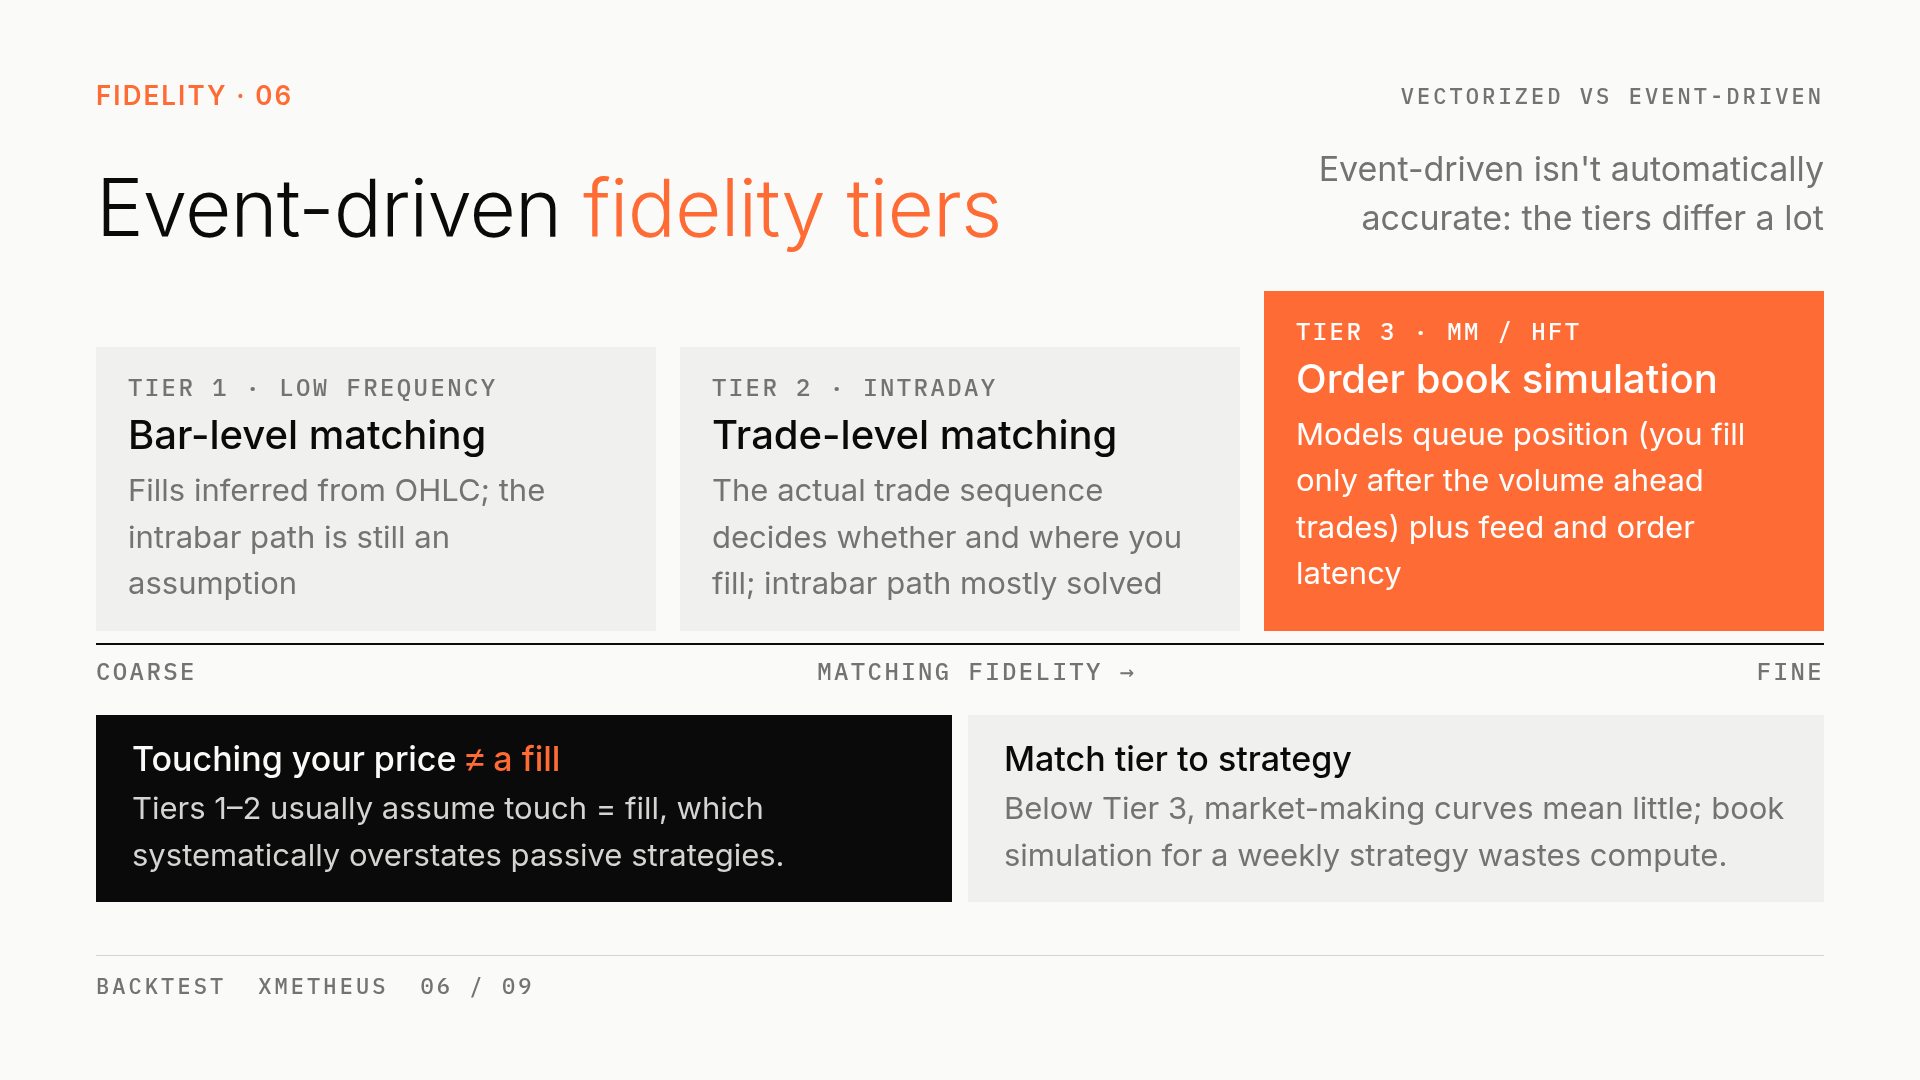
Tier 1: bar-level matching. Fills are inferred from OHLC, and the path inside the bar is still an assumption. Good for low to medium frequency: when holding periods are much longer than one bar, the error is acceptable.
Tier 2: trade-level matching. The actual sequence of trades decides whether your order fills and at what price. The intrabar-path problem is essentially solved. Suitable for intraday strategies.
Tier 3: order book simulation. On top of trades, it models where your limit order sits in the queue and how much volume ahead of you must trade before you get filled, plus market data latency and order latency. A detail that’s easy to miss: price touching your limit doesn’t mean you were filled. If the queue ahead of you isn’t cleared, you get nothing. Tiers 1 and 2 usually assume touch equals fill, which systematically overstates passive strategies.
So for market making and HFT, a backtest below Tier 3 tells you very little. Conversely, simulating the order book for a weekly strategy is wasted compute.
5. Choosing an open-source framework
Here are the common frameworks compared by type, core, fidelity, and whether the same code can go live:
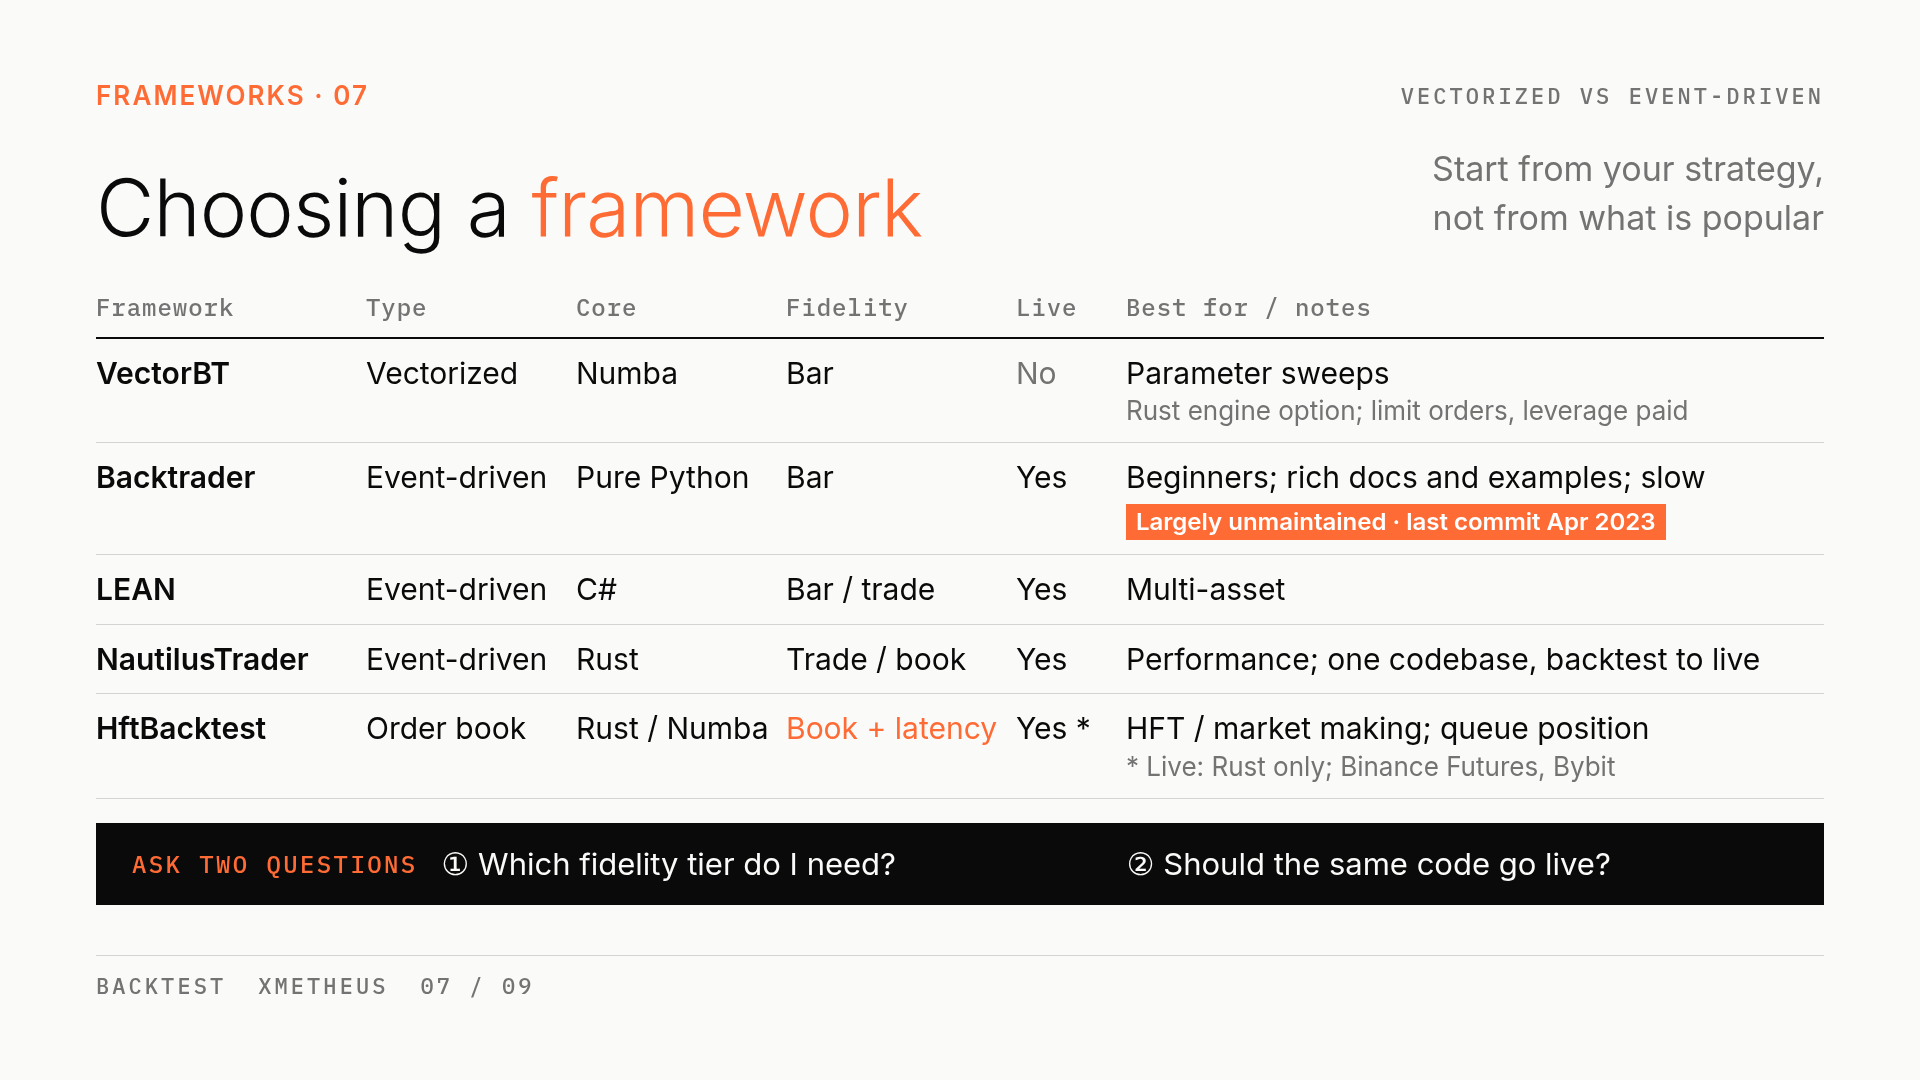
- VectorBT: vectorized, Numba core, bar-level, no direct live trading; best for parameter sweeps. The community edition offers an optional Rust engine, but features such as limit orders and leverage are in the paid version.
- Backtrader: event-driven, pure Python, bar-level, can trade live. Plenty of docs and examples, so it’s beginner-friendly, but it’s slow and the project is largely unmaintained (last commit in April 2023, no release since).
- LEAN: event-driven, C# core, supports both bars and trade-level data, can trade live; good for multi-asset work.
- NautilusTrader: event-driven, Rust core, fidelity down to trades and the order book, one codebase for backtest and live, performance-focused.
- HftBacktest: order-book level, Rust and Numba core, order book plus latency, simulates queue position; built for HFT and market making. Note that live trading is Rust-only and currently connects to Binance Futures and Bybit.
Don’t start from what’s popular. Ask two questions: which fidelity tier does my strategy need, and do I want the same code to go live? Those two answers usually narrow the field to one or two options.
6. The safer approach: chain them
One is fast and one is accurate, so the safer approach is to chain them.
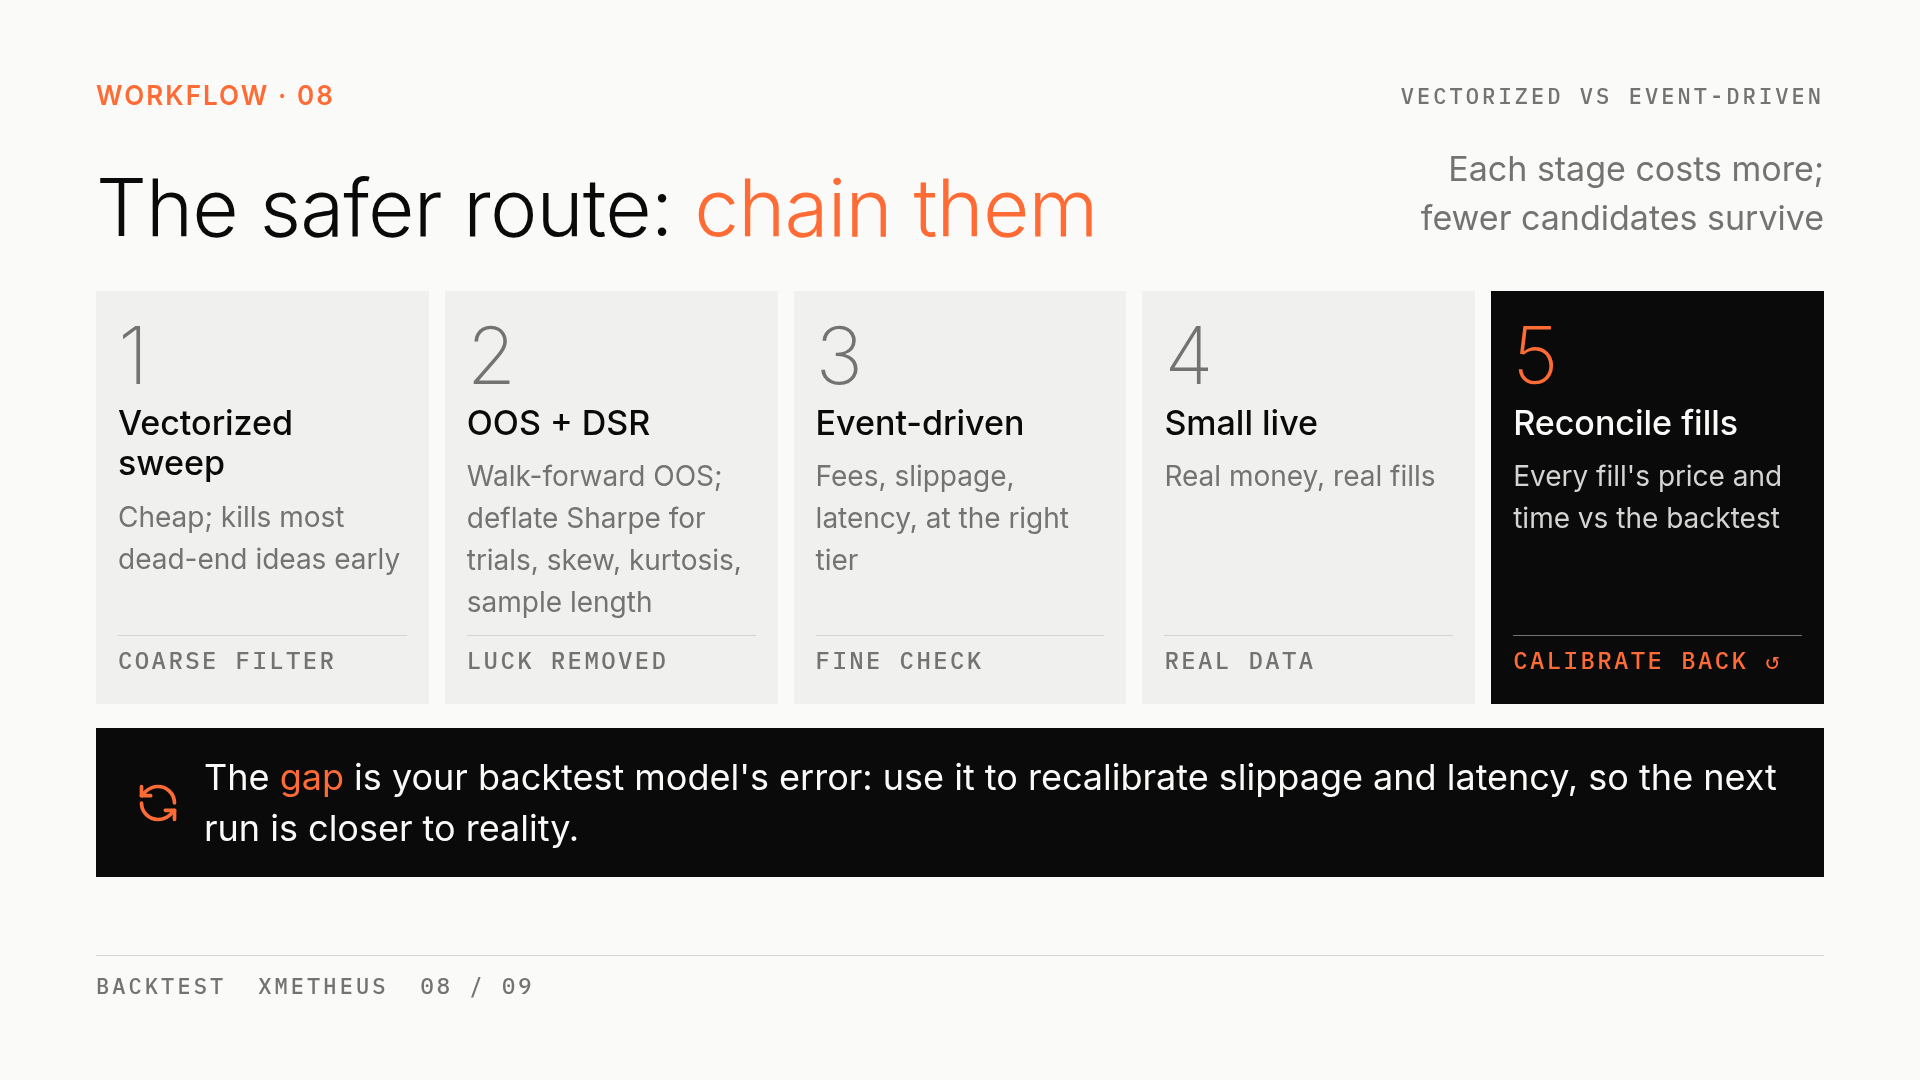
Step 1: sweep parameters with a vectorized backtest. It’s cheap and filters out most ideas that won’t work.
Step 2: run walk-forward out-of-sample tests and correct the Sharpe ratio for multiple testing. Many people skip this. If you tried a thousand parameter sets and picked the best one, a good part of its Sharpe is luck. The Deflated Sharpe Ratio (DSR) accounts for the number of trials, the skewness and kurtosis of returns, and the sample length to estimate how much of that Sharpe survives once luck is removed. The more you try, the bigger the haircut.
Step 3: run the few survivors through an event-driven backtest with fees, slippage and latency, choosing the fidelity tier as described above.
Step 4: go live with small capital and get real fills with real money.
Step 5: reconcile fill by fill. Compare the price and time of every live fill with the backtest. The gap you find is the error of your backtest model itself. Feed it back to recalibrate slippage and latency, and the next round of backtests gets closer to reality.
Bonus: where TradingView fits
Finally, TradingView, which many people use every day. It is also event-driven, but bar-stepped: by default it computes signals on the close and fills at the next bar’s open, and the path inside a bar is inferred from OHLC alone. If the open is closer to the high, it assumes price went to the high first and then the low, and the other way round.
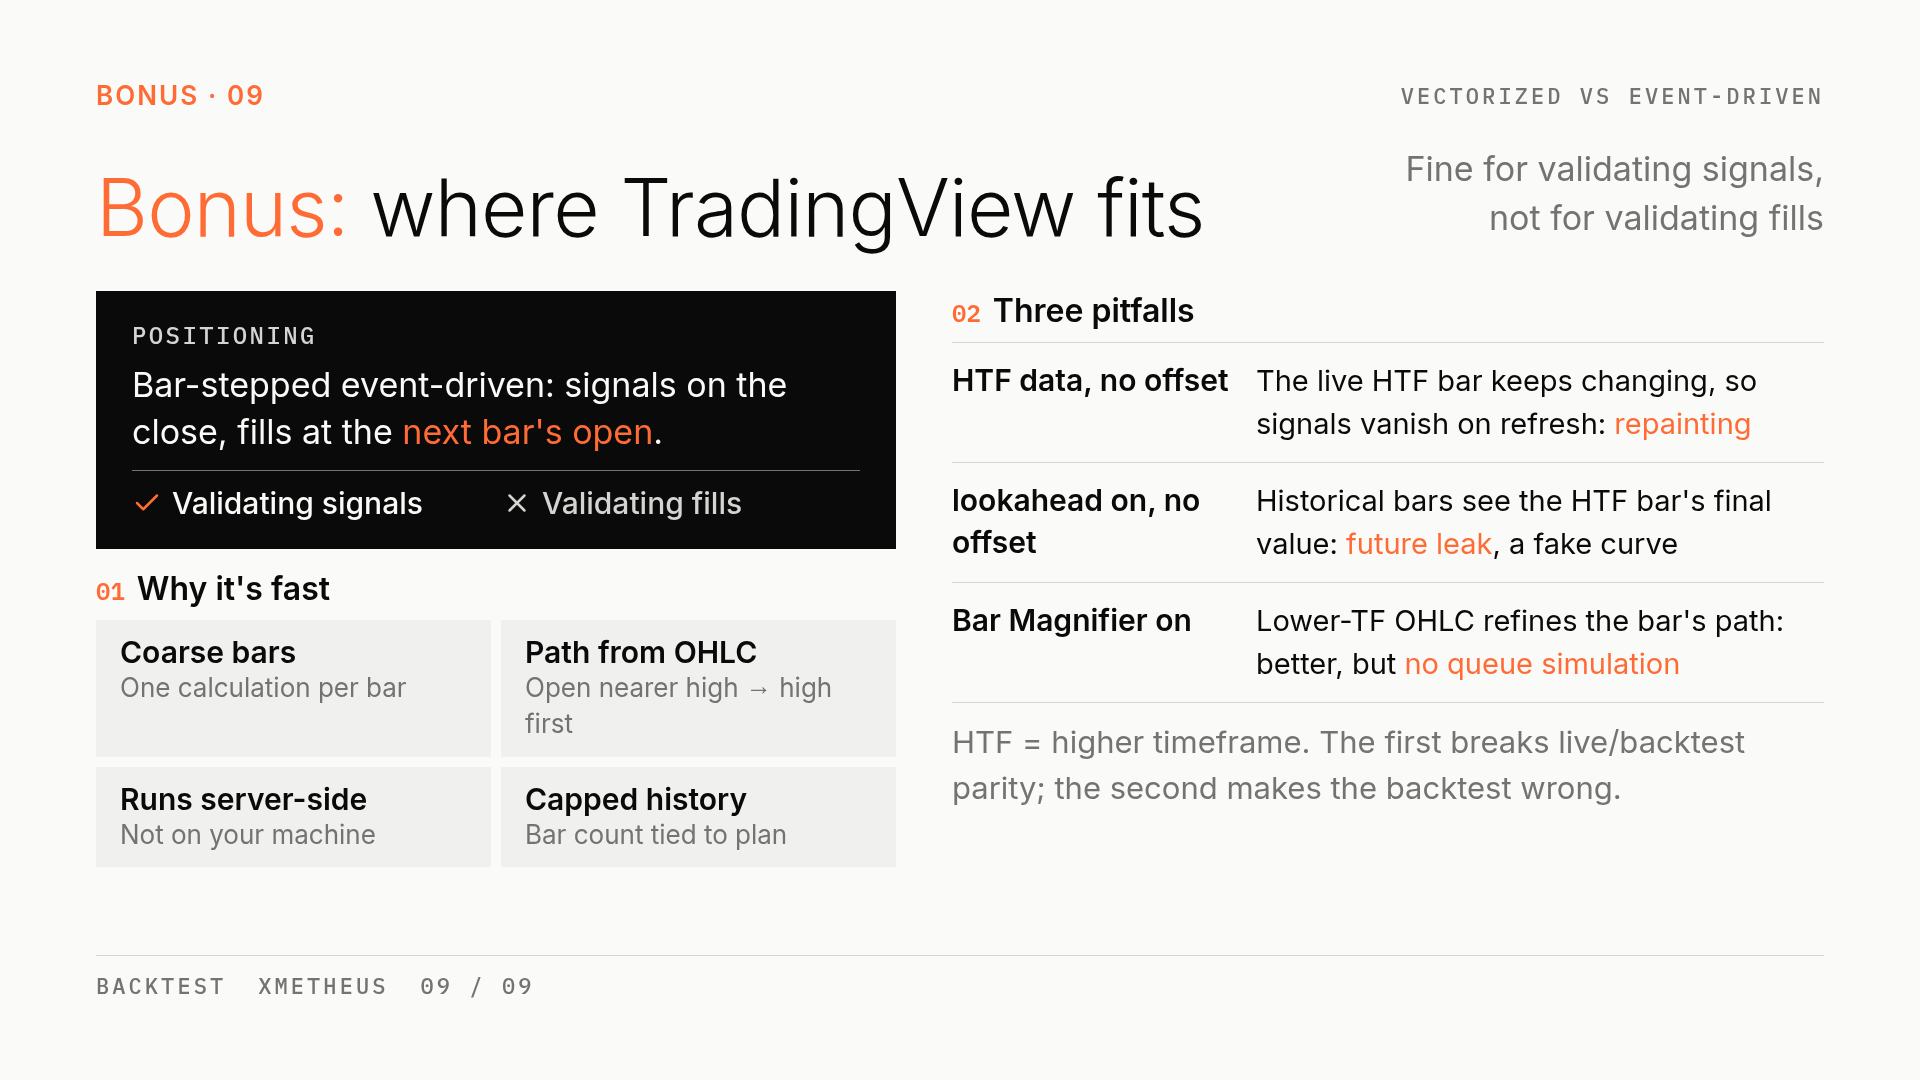
It’s fast for a few reasons: bars are coarse, so each bar is calculated once; matching is simplified, with the path inferred from OHLC; it runs on TradingView’s servers; and history is capped, with the number of available bars tied to your plan.
So it’s good enough for validating signals, but not for validating fills.
A few pitfalls deserve a separate mention:
- Pulling higher-timeframe data without a one-bar offset repaints. When you use
request.securityon a lower-timeframe chart to fetch higher-timeframe data, the live higher-timeframe bar hasn’t closed and its value keeps changing, so a signal you saw may disappear after a refresh. - Turning on
lookaheadwithout an offset leaks the future. On historical bars,lookaheadgives the current position the final value of that higher-timeframe bar, which is effectively knowing the close in advance. The curve looks great and is fake. The correct approach is to use the previous, completed value. - Bar Magnifier improves fidelity. It refines the intrabar path with lower-timeframe OHLC, which is more accurate than pure inference, but it still doesn’t simulate the order queue.
The two higher-timeframe issues are different problems: one is a value that changes on the live bar, the other is seeing the future on historical bars. The first makes live signals disagree with the backtest; the second makes the backtest itself wrong.
Speed and accuracy are hard to get at the same time in backtesting. Once you know what each architecture assumes, you know where to look for the error.